NHL teams’ payrolls have been capped for nearly a decade now, limiting the disparity between the big-market giants and their small-market counterparts. Still, the Philadelphia Flyers, who had the highest payroll in the league last season, spent over $23 million more than the NHL-owned Phoenix Coyotes. But the money didn’t matter: neither made the playoffs, and Phoenix actually finished two points ahead of Philly in the final standings. Did the teams that made it rain in 2013 get any bang for their buck? Let’s find out.
Here, courtesy of CapGeek, are the payrolls for every NHL team this past season:
| Team | Spending (USD) | |
|---|---|---|
| 1. | Philadelphia Flyers » | $72,549,431 |
| 2. | Vancouver Canucks » | $70,456,167 |
| 3. | Minnesota Wild » | $70,120,744 |
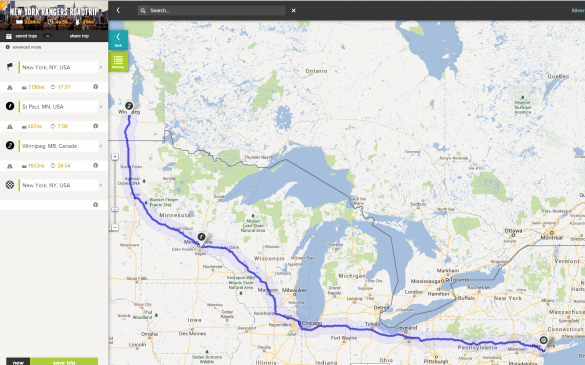
| 4. | New York Rangers » | $68,711,221 |
| 5. | Chicago Blackhawks » | $67,343,544 |
| 6. | Montreal Canadiens » | $66,857,720 |
| 7. | Pittsburgh Penguins » | $66,739,133 |
| 8. | San Jose Sharks » | $66,370,996 |
| 9. | Boston Bruins » | $64,486,562 |
| 10. | Tampa Bay Lightning » | $64,082,929 |
| 11. | Washington Capitals » | $64,053,698 |
| 12. | Toronto Maple Leafs » | $63,249,222 |
| 13. | Detroit Red Wings » | $62,823,032 |
| 14. | Los Angeles Kings » | $62,025,799 |
| 15. | Buffalo Sabres » | $61,437,023 |
| 16. | Calgary Flames » | $61,027,990 |
| 17. | New Jersey Devils » | $59,269,410 |
| 18. | Winnipeg Jets » | $58,447,941 |
| 19. | Florida Panthers » | $57,463,086 |
| 20. | Carolina Hurricanes » | $57,237,054 |
| 21. | Anaheim Ducks » | $56,931,061 |
| 22. | Colorado Avalanche » | $55,641,465 |
| 23. | Dallas Stars » | $53,967,129 |
| 24. | Columbus Blue Jackets » | $53,893,247 |
| 25. | Ottawa Senators » | $53,806,372 |
| 26. | Nashville Predators » | $53,723,203 |
| 27. | Edmonton Oilers » | $53,648,971 |
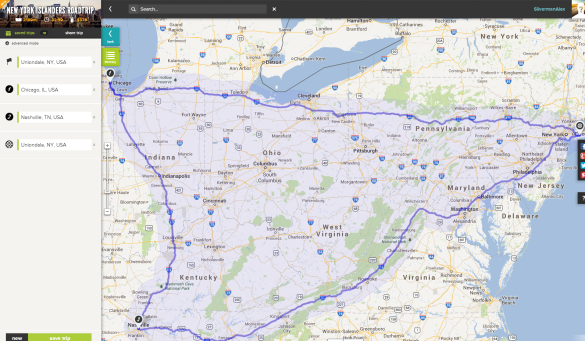
| 28. | New York Islanders » | $53,004,108 |
| 29. | St. Louis Blues » | $52,185,361 |
| 30. | Phoenix Coyotes » |
$49,438,632 |
And here, courtesy of NHL.com, are the final standings for the 2013 season. Note that despite conference affiliations, the top 16 teams in the league turned out to be the 16 that made the playoffs.
| Rank | DIV | GP | W | L | OT | P | |
|---|---|---|---|---|---|---|---|
| 1 | p – Chicago | CEN | 48 | 36 | 7 | 5 | 77 |
| 2 | z – Pittsburgh | ATL | 48 | 36 | 12 | 0 | 72 |
| 3 | y – Anaheim | PAC | 48 | 30 | 12 | 6 | 66 |
| 4 | y – Montréal | NE | 48 | 29 | 14 | 5 | 63 |
| 5 | x – Boston | NE | 48 | 28 | 14 | 6 | 62 |
| 6 | x – St. Louis | CEN | 48 | 29 | 17 | 2 | 60 |
| 7 | x – Los Angeles | PAC | 48 | 27 | 16 | 5 | 59 |
| 8 | y – Vancouver | NW | 48 | 26 | 15 | 7 | 59 |
| 9 | x – Toronto | NE | 48 | 26 | 17 | 5 | 57 |
| 10 | y – Washington | SE | 48 | 27 | 18 | 3 | 57 |
| 11 | x – San Jose | PAC | 48 | 25 | 16 | 7 | 57 |
| 12 | x – NY Rangers | ATL | 48 | 26 | 18 | 4 | 56 |
| 13 | x – Detroit | CEN | 48 | 24 | 16 | 8 | 56 |
| 14 | x – Ottawa | NE | 48 | 25 | 17 | 6 | 56 |
| 15 | x – Minnesota | NW | 48 | 26 | 19 | 3 | 55 |
| 16 | x – NY Islanders | ATL | 48 | 24 | 17 | 7 | 55 |
| 17 | Columbus | CEN | 48 | 24 | 17 | 7 | 55 |
| 18 | Winnipeg | SE | 48 | 24 | 21 | 3 | 51 |
| 19 | Phoenix | PAC | 48 | 21 | 18 | 9 | 51 |
| 20 | Philadelphia | ATL | 48 | 23 | 22 | 3 | 49 |
| 21 | Dallas | PAC | 48 | 22 | 22 | 4 | 48 |
| 22 | New Jersey | ATL | 48 | 19 | 19 | 10 | 48 |
| 23 | Buffalo | NE | 48 | 21 | 21 | 6 | 48 |
| 24 | Edmonton | NW | 48 | 19 | 22 | 7 | 45 |
| 25 | Calgary | NW | 48 | 19 | 25 | 4 | 42 |
| 26 | Carolina | SE | 48 | 19 | 25 | 4 | 42 |
| 27 | Nashville | CEN | 48 | 16 | 23 | 9 | 41 |
| 28 | Tampa Bay | SE | 48 | 18 | 26 | 4 | 40 |
| 29 | Colorado | NW | 48 | 16 | 25 | 7 | 39 |
| 30 | Florida | SE | 48 | 15 | 27 | 6 | 36 |
Now, let’s see which teams got the best value. Playoff teams are in bold.
| Team | Spending (USD) | Points | USD Spent/Point | |
| 1 | Anaheim Ducks | $56,931,061 | 66 | $862,591.83 |
| 2 | St. Louis Blues | $52,185,361 | 60 | $869,756.02 |
| 3 | Chicago Blackhawks | $67,343,544 | 77 | $874,591.48 |
| 4 | Pittsburgh Penguins | $66,739,133 | 72 | $926,932.40 |
| 5 | Ottawa Senators | $53,806,372 | 56 | $960,828.07 |
| 6 | New York Islanders | $53,004,108 | 55 | $963,711.05 |
| 7 | Phoenix Coyotes | $49,438,632 | 51 | $969,384.94 |
| 8 | Columbus Blue Jackets | $53,893,247 | 55 | $979,877.22 |
| 9 | Boston Bruins | $64,486,562 | 62 | $1,040,105.84 |
| 10 | Los Angeles Kings | $62,025,799 | 59 | $1,051,284.73 |
| 11 | Montreal Canadiens | $66,857,720 | 63 | $1,061,233.65 |
| 12 | Toronto Maple Leafs | $63,249,222 | 57 | $1,109,635.47 |
| 13 | Detroit Red Wings | $62,823,032 | 56 | $1,121,839.86 |
| 14 | Washington Capitals | $64,053,698 | 57 | $1,123,749.09 |
| 15 | Dallas Stars | $53,967,129 | 48 | $1,124,315.19 |
| 16 | Winnipeg Jets | $58,447,941 | 51 | $1,146,038.06 |
| 17 | San Jose Sharks | $66,370,996 | 57 | $1,164,403.44 |
| 18 | Edmonton Oilers | $53,648,971 | 45 | $1,192,199.36 |
| 19 | Vancouver Canucks | $70,456,167 | 59 | $1,194,172.32 |
| 20 | New York Rangers | $68,711,221 | 56 | $1,226,986.09 |
| 21 | New Jersey Devils | $59,269,410 | 48 | $1,234,779.38 |
| 22 | Minnesota Wild | $70,120,744 | 55 | $1,274,922.62 |
| 23 | Buffalo Sabres | $61,437,023 | 48 | $1,279,937.98 |
| 24 | Nashville Predators | $53,723,203 | 41 | $1,310,322.02 |
| 25 | Carolina Hurricanes | $57,237,054 | 42 | $1,362,787.00 |
| 26 | Colorado Avalanche | $55,641,465 | 39 | $1,426,704.23 |
| 27 | Calgary Flames | $61,027,990 | 42 | $1,453,047.38 |
| 28 | Philadelphia Flyers | $72,549,431 | 49 | $1,480,600.63 |
| 29 | Florida Panthers | $57,463,086 | 36 | $1,596,196.83 |
| 30 | Tampa Bay Lightning | $64,082,929 | 40 | $1,602,073.23 |
Finally, let’s take a look at the differential between teams’ spending positions and their standings positions:
| Position Differential Rank | Team | Spending Position | Standings Position | Position Differential |
| 1 | St. Louis Blues | 29 | 6 | +23 |
| 2 | Anaheim Ducks | 21 | 3 | +18 |
| 3 | New York Islanders | 28 | 16 | +12 |
| t4 | Ottawa Senators | 25 | 14 | +11 |
| t4 | Phoenix Coyotes | 30 | 19 | +11 |
| t6 | Columbus Blue Jackets | 24 | 17 | +7 |
| t6 | Los Angeles Kings | 14 | 7 | +7 |
| 8 | Pittsburgh Penguins | 7 | 2 | +5 |
| t9 | Chicago Blackhawks | 5 | 1 | +4 |
| t9 | Boston Bruins | 9 | 5 | +4 |
| t11 | Toronto Maple Leafs | 12 | 9 | +3 |
| t11 | Edmonton Oilers | 27 | 24 | +3 |
| t13 | Montreal Canadiens | 6 | 4 | +2 |
| t13 | Dallas Stars | 23 | 21 | +2 |
| 15 | Washington Capitals | 11 | 10 | +1 |
| t16 | Detroit Red Wings | 13 | 13 | 0 |
| t16 | Winnipeg Jets | 18 | 18 | 0 |
| 18 | Nashville Predators | 26 | 27 | -1 |
| 19 | San Jose Sharks | 8 | 11 | -3 |
| 20 | New Jersey Devils | 17 | 22 | -5 |
| t21 | Vancouver Canucks | 2 | 8 | -6 |
| t21 | Carolina Hurricanes | 20 | 26 | -6 |
| 23 | Colorado Avalanche | 22 | 29 | -7 |
| t24 | New York Rangers | 4 | 12 | -8 |
| t24 | Buffalo Sabres | 15 | 23 | -8 |
| 26 | Calgary Flames | 16 | 25 | -9 |
| 27 | Florida Panthers | 19 | 30 | -11 |
| 28 | Minnesota Wild | 3 | 15 | -12 |
| 29 | Tampa Bay Lightning | 10 | 28 | -18 |
| 30 | Philadelphia Flyers | 1 | 20 | -19 |
So what can we take away from all these numbers and charts?
- Despite making the playoffs, one might have expected the Sharks, Canucks, Rangers and Wild to accrue more points and make deeper runs.
- Payroll-wise, the Coyotes and Blue Jackets overachieved big-time despite missing the playoffs.
- Only two of the ten highest-spending teams — the Flyers and Lightning — missed the playoffs.
- Three of the ten lowest-spending teams — the Ducks, Islanders and Blues — made the playoffs.
- None of the three made it past the first round.
EDIT: Reader Matt spots an error in our analysis:
“4 of the bottom 10 spending teams made the playoffs…. And the one you missed also made it to the second round… the Ottawa Senators.”
- None of the three made it past the first round.
Let’s check out, as of today, how much each NHL team will be spending in 2013-14, again courtesy of CapGeek:
| Team | Salary Payroll
|
Cap Payroll
|
||
|---|---|---|---|---|
| 1. | Philadelphia Flyers » | $76,194,117 | $69,153,522 | |
| 2. | Boston Bruins » | $65,440,000 | $70,223,810 | |
| 3. | Pittsburgh Penguins » | $70,810,000 | $65,398,333 | |
| 4. | Detroit Red Wings » | $68,200,000 | $67,947,879 | |
| 5. | San Jose Sharks » | $63,756,666 | $65,131,667 | |
| 6. | Los Angeles Kings » | $68,810,000 | $64,386,894 | |
| 7. | Edmonton Oilers » | $58,841,666 | $67,774,167 | |
| 8. | Chicago Blackhawks » | $67,760,000 | $62,946,795 | |
| 9. | Columbus Blue Jackets » | $60,976,667 | $66,808,809 | |
| 10. | New York Rangers » | $65,226,666 | $62,881,667 | |
| 11. | Winnipeg Jets » | $57,701,000 | $63,201,357 | |
| 12. | Dallas Stars » | $58,368,334 | $62,993,611 | |
| 13. | Tampa Bay Lightning » | $64,953,572 | $63,990,477 | |
| 14. | Minnesota Wild » | $67,152,778 | $65,265,534 | |
| 15. | Montreal Canadiens » | $64,465,000 | $63,610,833 | |
| 16. | Anaheim Ducks » | $57,145,000 | $62,795,833 | |
| 17. | Vancouver Canucks » | $64,489,000 | $59,952,778 | |
| 18. | Nashville Predators » | $62,326,666 | $62,862,976 | |
| 19. | Carolina Hurricanes » | $59,365,000 | $59,425,000 | |
| 20. | Toronto Maple Leafs » | $58,996,434 | $59,704,167 | |
| 21. | Washington Capitals » | $56,725,000 | $58,634,295 | |
| 22. | Phoenix Coyotes » | $52,300,000 | $58,176,667 | |
| 23. | St. Louis Blues » | $56,991,667 | $57,925,833 | |
| 24. | Calgary Flames » | $51,717,500 | $57,321,250 | |
| 25. | New Jersey Devils » | $55,383,333 | $59,720,834 | |
| 26. | Colorado Avalanche » | $55,565,000 | $58,833,333 | |
| 27. | Buffalo Sabres » | $54,745,833 | $54,645,357 | |
| 28. | Ottawa Senators » | $50,877,500 | $53,835,833 | |
| 29. | Florida Panthers » | $50,176,209 | $57,140,375 | |
| 30. | New York Islanders » | $44,431,500 | $49,496,976 |
Who do you think will outperform their payroll in 2013-14? Who is spending the most on a pile of crap? Tell us in the comments!
Related Reading:
Panther Parkway lists the NHL’s five best “Puck for Your Buck” Contracts
Sports Illustrated looks at the smartest deals of the summer